
Understanding Standard Scores Using the Bell Curve: Parent-Friendly Guide by Schoolpsych.com
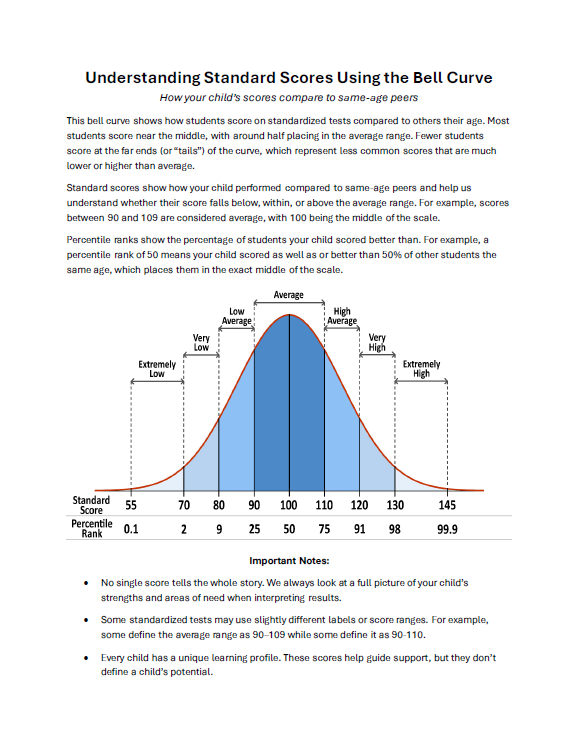
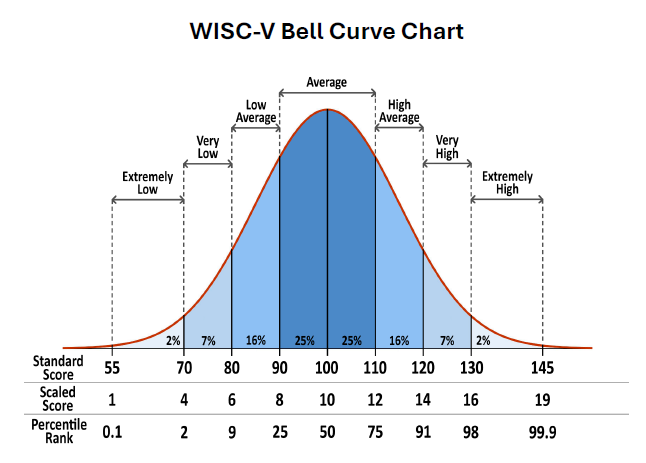
Version 3: Labeled Bell Curve Visual (Average Range: 90 - 109)
Word Document:
PDF:
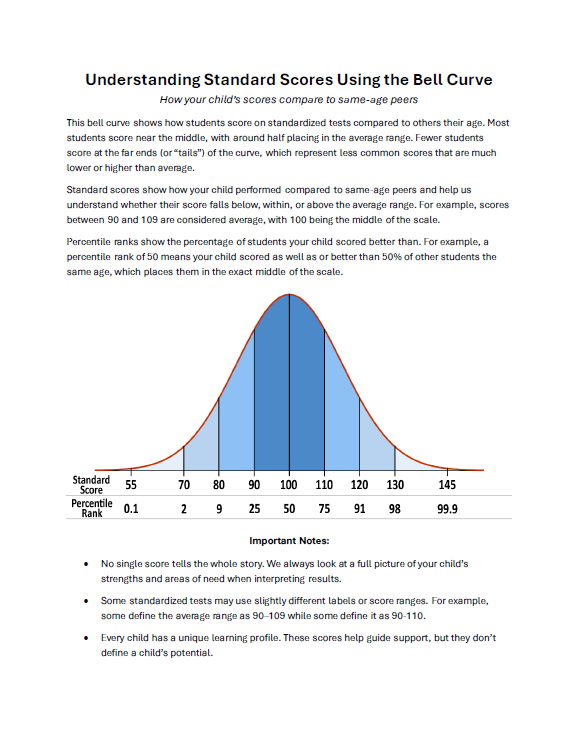
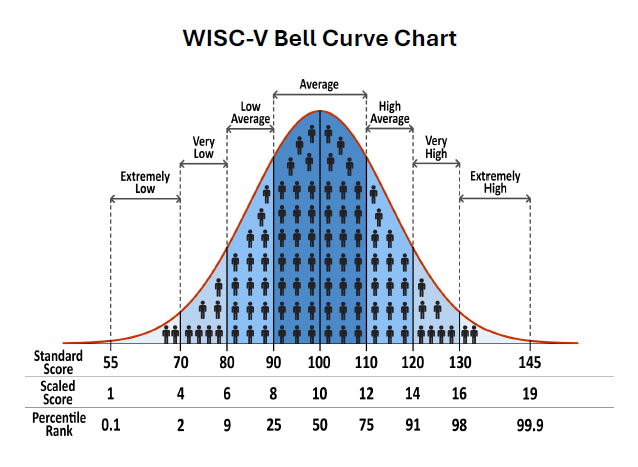
Version 4: Bell Curve Visual - Descriptors Removed (Average Range: 90 - 109)
Word Document:
PDF:
Version 5: Editable Descriptors (Average Range: 90 - 109)
Bell Curve 90 109 Editable Descriptors Version 5
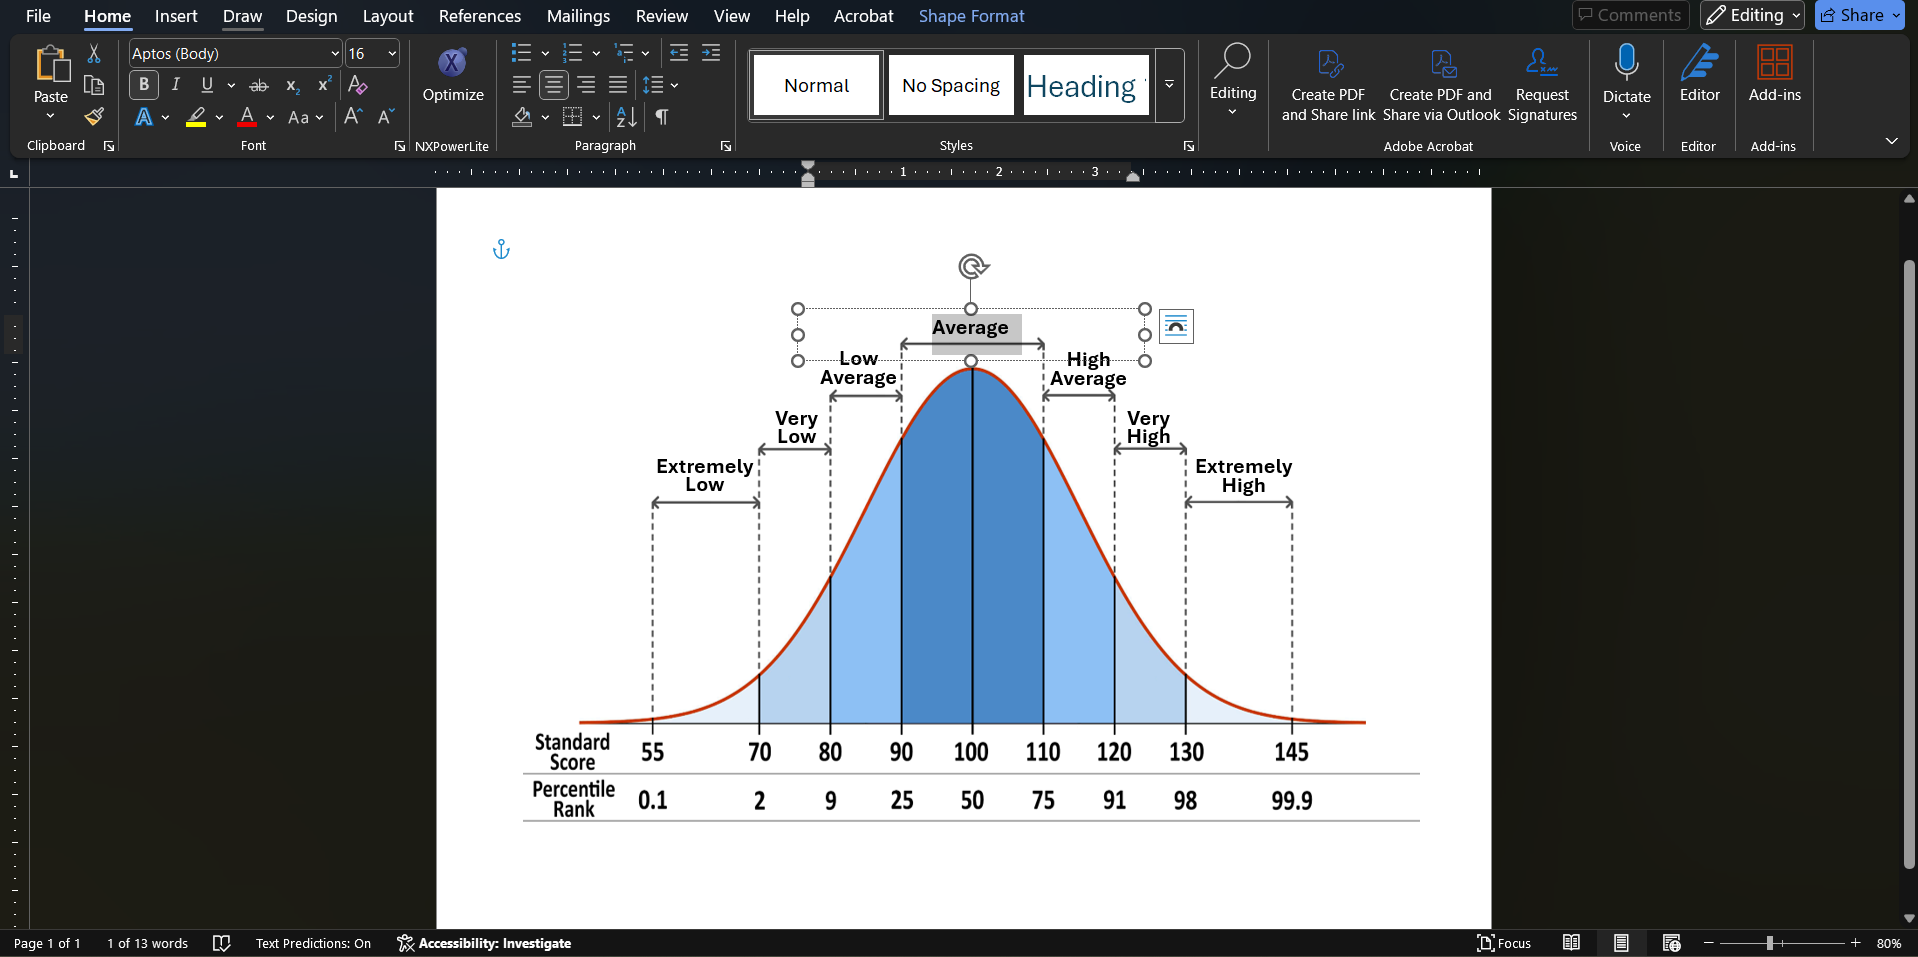
Understanding Standard Scores Using the Bell Curve
PDF:
Understanding Standard Scores Using the Bell Curve
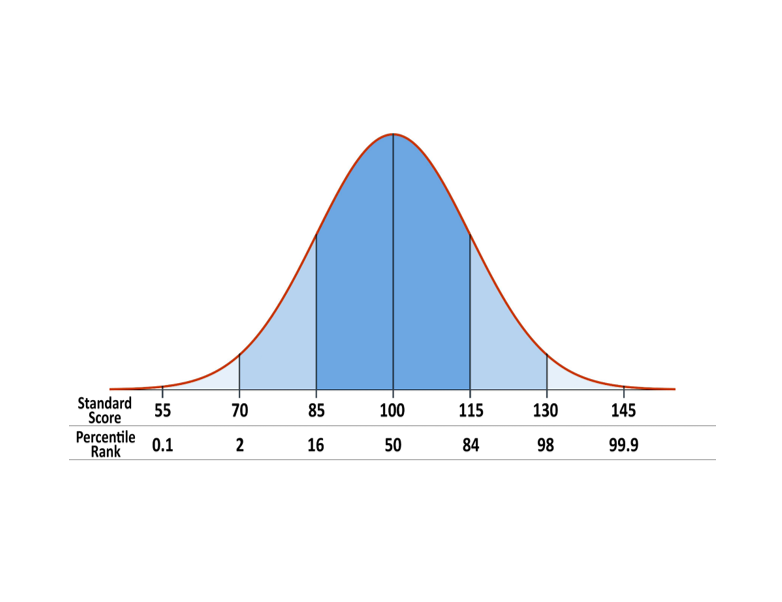
Version 2: Descriptors Removed From Bell Curve Visual (Average Range: 85 - 115)
Word Document:
Understanding Standard Scores Using the Bell Curve Version 2
PDF:
Understanding Standard Scores Using the Bell Curve Version 2
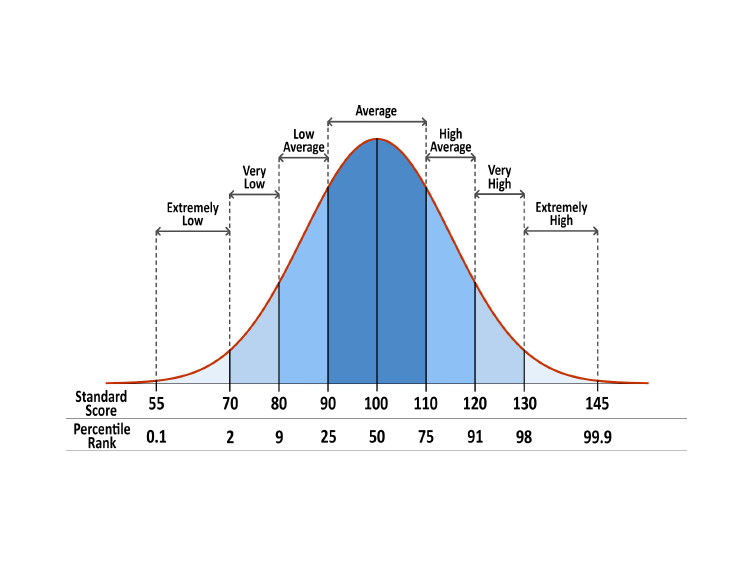
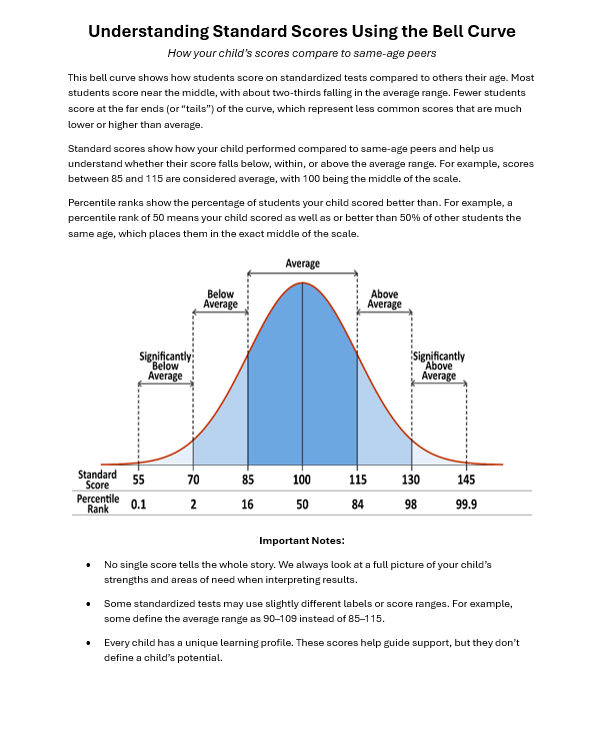
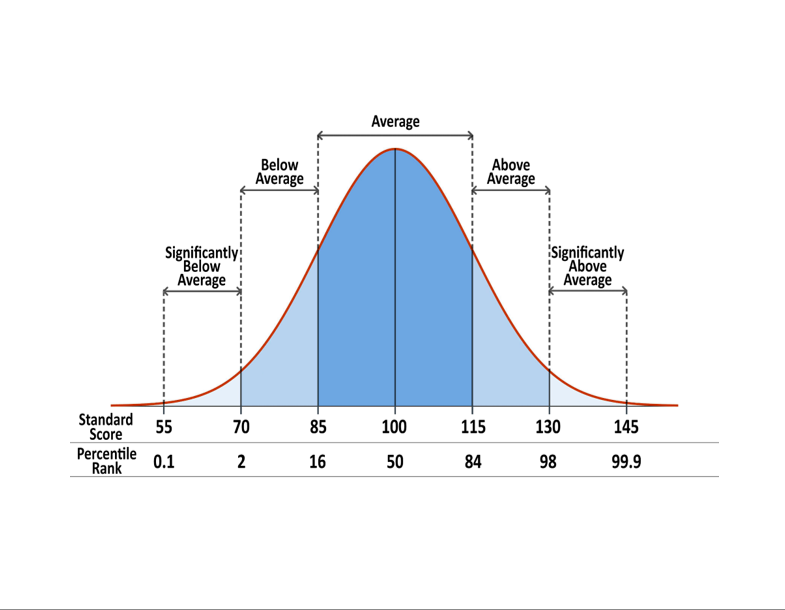
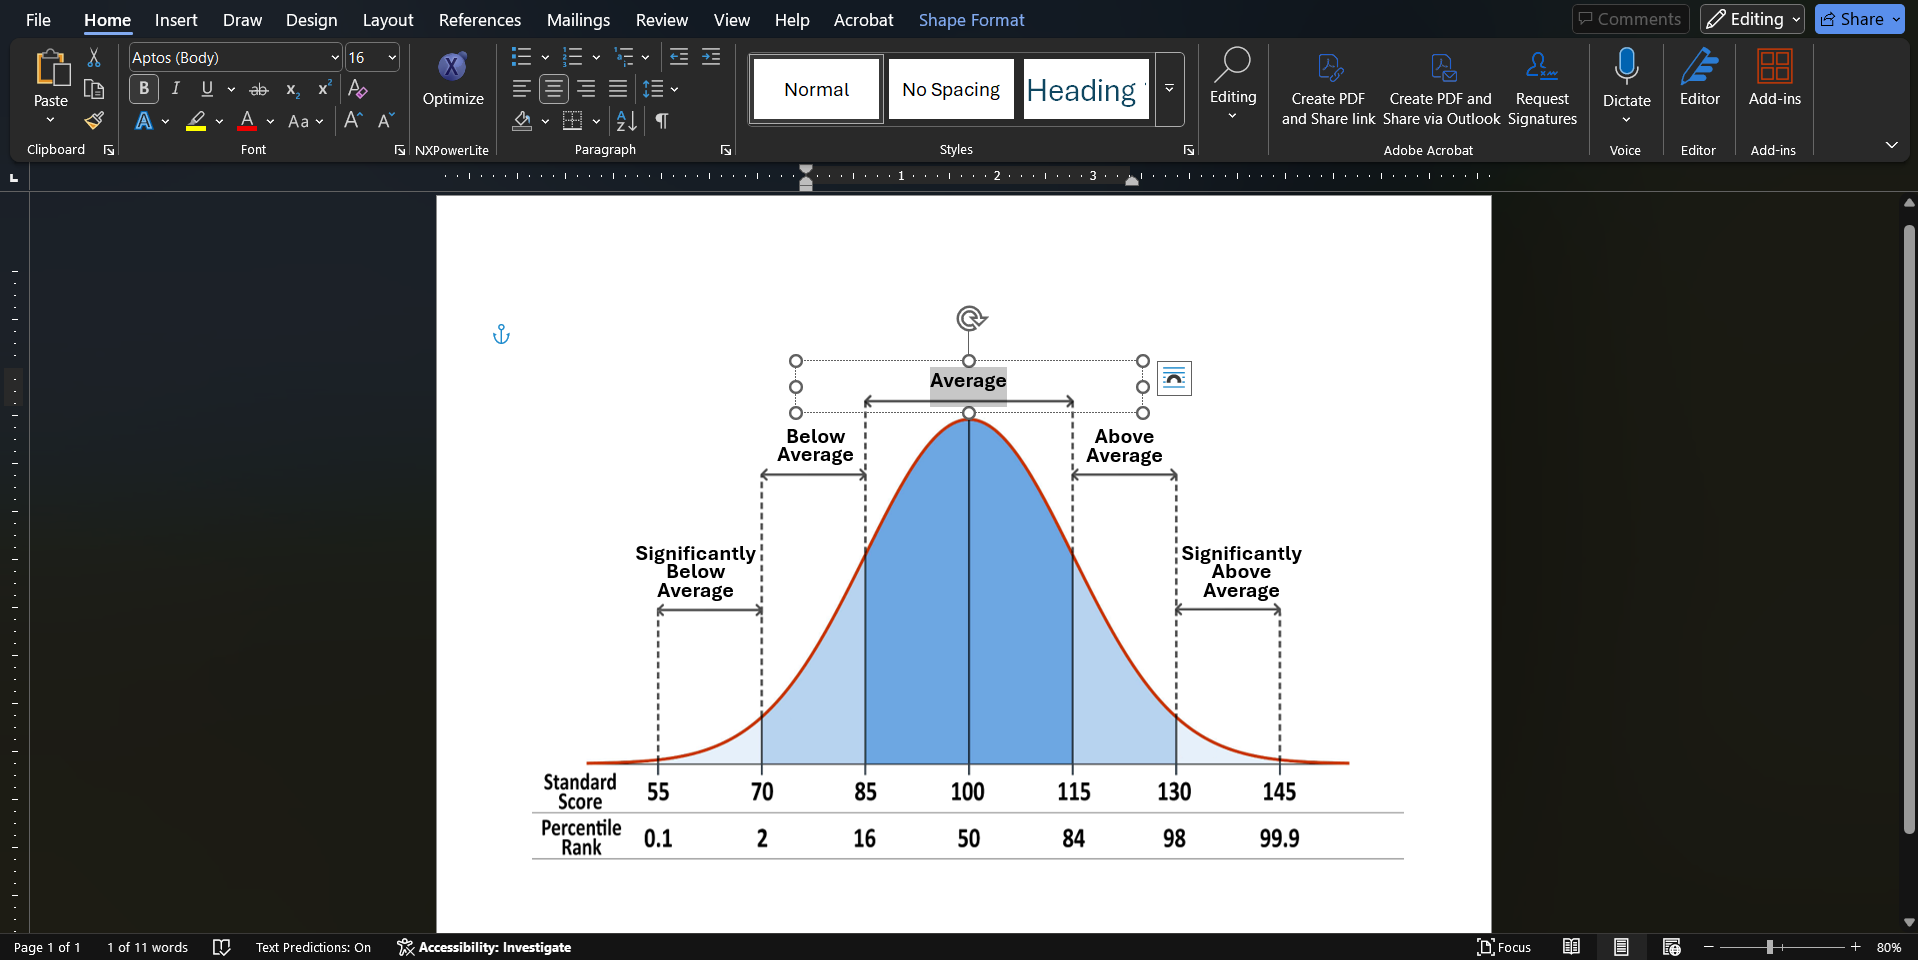
Version 3: Labeled Bell Curve Visual (Average Range: 85 - 115)
Word Document:
PDF:
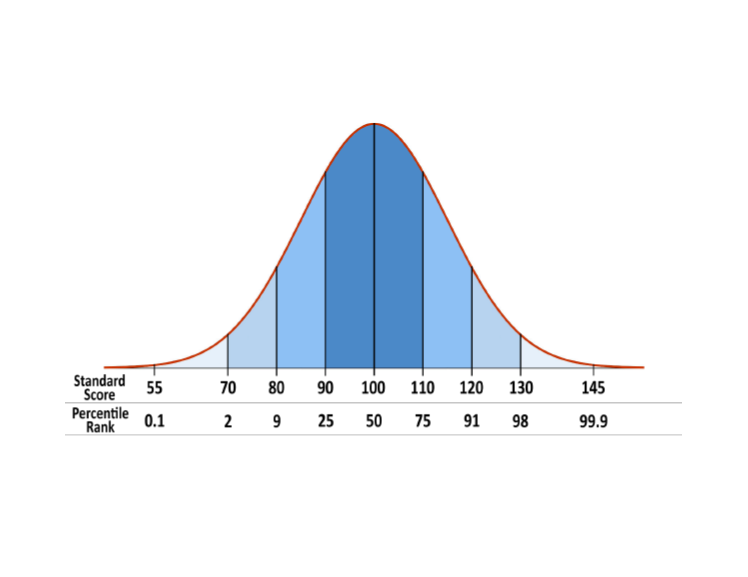
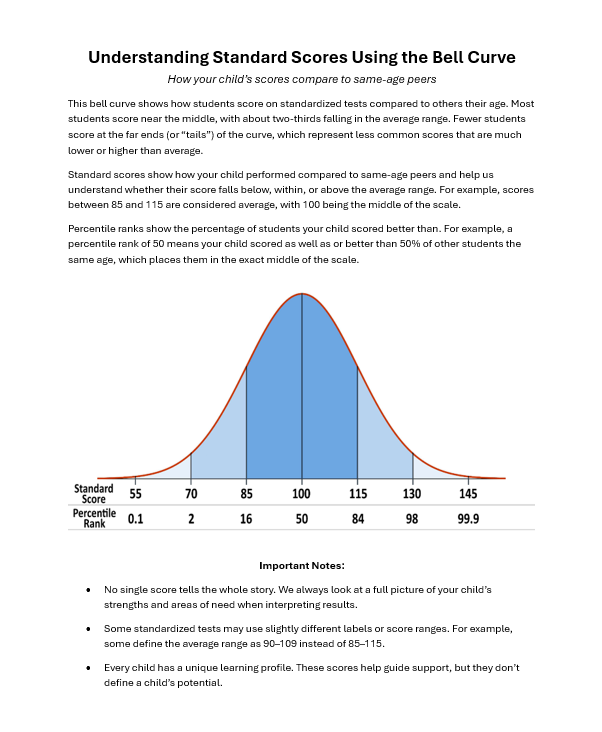
Version 4: Bell Curve Visual - Descriptors Removed (Average Range: 85 - 115)
Word Document:
PDF:
Version 5: Editable Descriptors (Average Range: 85 - 115)
Bell Curve 85 115 Editable Descriptors Version 5
Disclaimer:
These documents are intended for educational use by school psychologists and related professionals. Selling these documents is strictly prohibited.